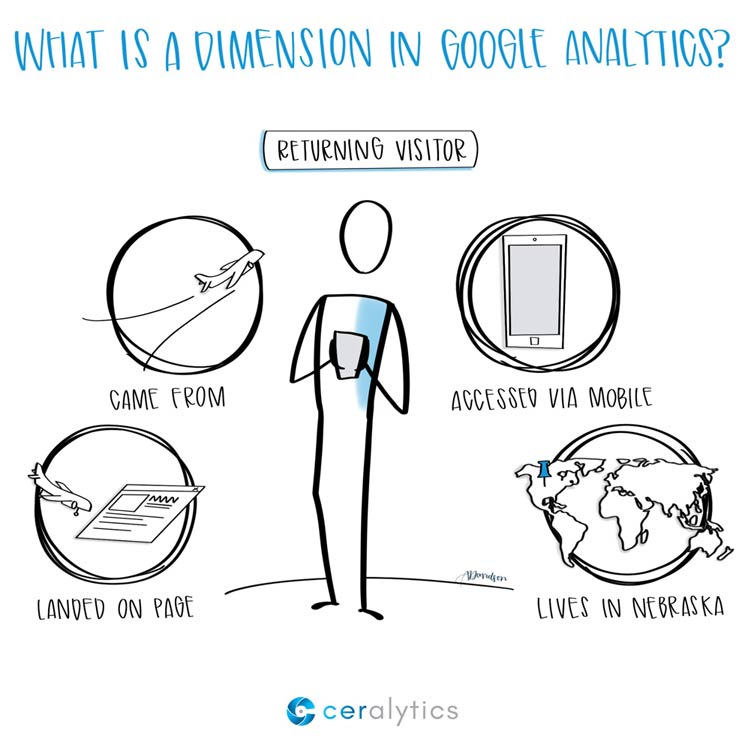
A Google Analytics dimension is basically a characteristic of users that visit a website. For example, if a woman in Nebraska visits your website, Google Analytics will store that information in the dimensions “State” for the state she’s from (Nebraska) and the dimension “Gender” for her gender (Female).
These dimensions are used to categorize user data to better understand how groups of users interact on your site.

Common dimensions include:
- Channel
- Source / Medium
- Device Category (mobile, desktop, or tablet)
- Browser
- User Type (New vs. Returning)
- Gender
- Age
- City
- State
- Country
- Operating System
- Landing Page
Why we need dimensions
Without dimensions in Google Analytics, there would only be one cut of data for your entire website – ALL VISITORS.
Back in the early days of the Internet, this was common. You could see how many visitors came to your site, and in some cases how many pages people visited on average. But if you wanted any detail about those visitors, such as where they came from (channel), whether they were new to your site or returning, or any kind of demographic information, you were out of luck.
Luckily, the world of website metrics has changed a lot since then. But with that change also came confusion.
Dimensions vs. Metrics
Dimensions often get confused with metrics in Google Analytics. Metrics are actual numbers that we use to measure various activities within a dimension. For example, metrics we’re all familiar with are Users and Sessions.
Using a combination of dimensions and metrics, we can understand what a segment of our users are doing. We can cut our data by Channel (dimension) and see how many Users (metric) and Sessions (metric) came from each specific channel.
| DIMENSION | METRIC | METRIC |
| Default Channel Grouping | Users | Sessions |
| Organic Search | 1,254 | 1,655 |
| Direct | 933 | 1,037 |
| Referral | 733 | 789 |
Combining Dimensions
Dimensions can also be combined to dig further into each group of visitors. You can combine dimensions to see Organic Search traffic from specific locations, the breakout of cities within a single state, or any other combination that gets you actionable data you need.
| DIMENSION | DIMENSION | METRIC | METRIC |
| State | City | Users | Sessions |
| Nebraska | Omaha | 290 | 311 |
| Nebraska | Lincoln | 93 | 101 |
| Nebraska | Grand Island | 92 | 98 |
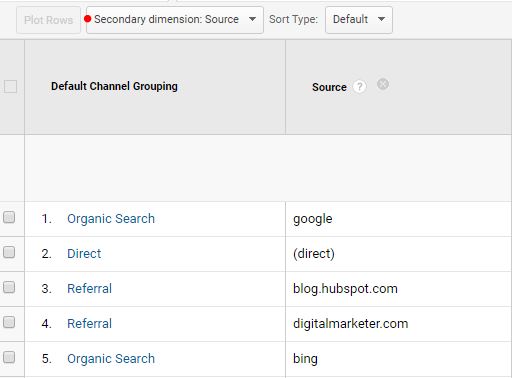
To combine dimensions in Google Analytics, simply select the drop down “Secondary dimension” in the results table.

Next Steps
As mentioned before, a dimension is simply a categorization of traffic on your site, and you can use it to really dig into how different groups of people use your site and where those people come from.
By looking at specific dimensions like Channels, you can see how well each of those channels perform vs. each other. You can then dig deeper by adding a Secondary Dimension in Google Analytics to get a more granular view of that traffic.
About Sketchalytics
Each week we send out a micro-lesson in marketing and/or business.
Our goal is NOT to give you best practices to go out and do what other people do. You can get that anywhere.
Instead, our goal is to give you knowledge that you can apply to your own organization to make the best decisions possible.
If you know anyone who you think would benefit from Sketchalytics, please feel free to share this with them so they can sign up.


